Load-store conflicts
03 May 2025meshoptimizer implements several geometry compression algorithms that are designed to take advantage of redundancies common in mesh data and decompress quickly - targeting many gigabytes per second in decoding throughput. One of them, index decoder, has seen a significant and unexpected variance in performance across multiple compilers and compiler releases recently; upon closer investigation, the differences can mostly be attributed to the same microarchitectural detail that is not often talked about. So I thought it would be interesting to write about it.
Algorithm
The encoding in this case is specialized to index buffers that store triangle lists; every triangle is represented by three vertex indices, so the job of the decoder is to compute the three indices and write them to the output buffer. The encoding scheme takes advantage of multiple sources of redundancy1 present in carefully optimized index buffers - for the sake of the performance investigation here, we’ll omit most of details except for a central intermediate structure used by both the encoder and decoder: the edge FIFO.
The edge FIFO contains up to 16 triangle edges - pairs of 32-bit indices - and the encoded form of each triangle can reference a previously encountered edge. Thus, to decode the triangle, we need to read the recently seen edge from the FIFO like so:
unsigned int a = edgefifo[(edgefifooffset - 1 - fe) & 15][0];
unsigned int b = edgefifo[(edgefifooffset - 1 - fe) & 15][1];
… then read and decode the third vertex, c, write two new edges of the triangle, bc and ca, using a simple function:
void pushEdgeFifo(EdgeFifo fifo, unsigned int a, unsigned int b, size_t& offset)
{
    fifo[offset][0] = a;
    fifo[offset][1] = b;
    offset = (offset + 1) & 15;
}
… and finally write the triangle (indices a, b, c) to the output buffer.
All other details are not material to the performance differences we are going to discuss: there are multiple less commonly encountered paths through the decoder, the third vertex can be encoded using multiple different ways, etc. For simplicity, let’s focus on the FIFO in question and the code that reads and writes data to it. The FIFO is simply a 16-element array with two integers per element:
typedef unsigned int EdgeFifo[16][2];
This code is simple and straightforward; what can possibly go wrong?
Baseline: clang-20 x86_64
The decoder is used at runtime to decompress the data; when using 32-bit indices, the output form of each triangle is 3 32-bit indices, or 12 bytes of data. Performance of the decoding loop is critical; here and below, we will measure performance as gigabytes per second2 written (assuming 32-bit indices), and cycles per triangle. If 16-bit indices are used, most of the code except for writing the triangle runs the same instructions and costs the same, so the expected effective bandwidth is approximately halved, but the cycles per triangle stay the same.
In production, we’d expect that this code is compiled using clang (when targeting mobile or console hardware, or macOS and, in some cases, Windows) or MSVC (when targeting Windows or Xbox). We’ll ignore MSVC here: it has some other challenges with this loop but they are outside of the scope of this post. So, let’s look at how clang (using clang-20) compiles accesses to this array and how fast does the loop run. For simplicity, we’ll ignore most of the loop and just focus on the instructions that read or write to the FIFO or the triangle output buffer3:
; read edge ab from FIFO
mov     r11d,DWORD PTR [rsp+rdx*8-0x10]
mov     edx,DWORD PTR [rsp+rdx*8-0xc]
...
; write edges bc and ca
mov     DWORD PTR [rsp+rbx*8-0x10],ebp
mov     DWORD PTR [rsp+rbx*8-0xc],edx
mov     DWORD PTR [rsp+r15*8-0x10],r11d
mov     DWORD PTR [rsp+r15*8-0xc],ebp
...
; write triangle abc
mov     DWORD PTR [rdi+r10*4],r11d
mov     DWORD PTR [rdi+r10*4+0x4],edx
mov     DWORD PTR [rdi+r10*4+0x8],ebp
The code is straightforward and easy to understand: a and b are read into r11d and edx registers; code not shown here reads c into ebp; and then we write each pair back into FIFO. Because the FIFO accesses are done modulo 16, the writes use two separate indices: these are often sequential, but if the first edge is written to index 15, the next edge will go to index 0, which complicates the address math a bit. This is roughly what I would expect to see from a competent compiler; index codec was originally developed in 2017 and my recollection is that this is similar to what the compilers at the time would produce as well.
When running this code on typical dense/regular meshes, on AMD Ryzen 7950X it decodes at, approximately, 6.6 GB/s; at 5.47 GHz, this corresponds to ~9.9 cycles taken to decode every triangle. Pretty good!
Store-to-load forwarding
To understand the performance characteristics of this code, it’s important to note that FIFO elements that are written on one iteration will often be read on the next iteration. A triangle is likely to share an edge with one of the triangles seen very recently; this allows a fairly small FIFO to still capture most of the edge reuse.
If you’ve written code that targets the PowerPC generation of game consoles, like Xbox 360 and PlayStation 3, you might be getting worried right about now. If you haven’t, let me introduce you to store buffers and Load-Hit-Store.
When the processor executes a store instruction, it’s tempting to assume that the write goes straight to the L1 cache. However, this would be inefficient: a write to L1 cache may require fetching the cache line from the next cache level or even memory, and we are likely to see a write to the same cache line follow soon after. For in-order CPUs, it is critical to amortize the cost of writes in this case, so most in-order CPUs include a special queue, usually called a store buffer; writes go to that queue when the store instruction executes, and eventually make their way to the cache line / memory. For out-of-order CPUs, this is also ubiquitous as store buffers help reduce the amount of time store instructions spend in the retirement queues, and enable executing store instructions speculatively (as the pending stores can be committed or discarded, but all cache writes are final).
If a store instruction does not update the cache immediately, how do load instructions work? What happens when a load instruction needs to access memory that has a pending store in the store buffer?
On the in-order PowerPC CPUs in PlayStation 3 / Xbox 360 consoles this would trigger a condition known as Load-Hit-Store: if the load touched the address that has been written to recently and the write was still in the store buffer (for ~20 cycles), the execution would stall to give the store enough time to finish (for ~40 cycles) and make it to the L2 cache. Needless to say, this was extremely expensive: it was common to see code that’s spending most of its time in LHS stalls on innocuous instruction sequences like repeatedly incrementing the size field stored inside a structure.
Notably, the load may only check a subset of the store address bits, and assume there’s a match even when there isn’t; my recollection is that on Xbox 360 in particular, only 12 bits of the address were checked, which resulted in 4K LHS aliasing: some patterns that didn’t exhibit a physical load-store overlap would still be subject to the significant penalty! This is similar in modern CPUs as well, but the consequences are much less dire.
Fortunately, most CPUs, even old in-order ARM chips that you can still see in very low-end mobile phones, implement a feature called store-to-load forwarding: if a load sees a pending store to the same address in the store buffer, it takes the value from the latest associated entry in the store buffer instead of reading it from the cache. This allows code like the FIFO update above to still run very efficiently, and often is as fast or faster than reading from the cache. Life is good these days.
Pleasant surprise: gcc-14 x86_64
As mentioned above, most production workloads where decoder performance is critical are using clang or MSVC as the compilers; gcc is a little bit more of an outlier, as it is only used on Linux and even then, often commercial games would choose to use clang to build the code for Linux instead. Often gcc trails clang a little bit on some other parts of the decoder family, which is completely fine and not a cause for concern. That said, ever since switching to Linux as my main OS, I would occasionally profile gcc just because it’s the default system wide compiler.
So at one point I was pleasantly surprised to discover that gcc (as late as gcc-14, which is the default compiler on latest Ubuntu) significantly outperforms clang on this code: clang built decoder achieves 6.6 GB/s (~9.9 cycles/triangle), and gcc-14 runs this code at ~7.5 GB/s (~8.7 cycles/triangle). That’s a significant improvement! After investigating the differences in the generated code, it looked like the gains are mostly attributed to the same FIFO code that is compiled very differently:
; read FIFO entry twice: as a 64-bit pair (into rbp) and two 32-bit values (xmm)
mov       rbp,QWORD PTR [rsp+rcx*8+0x70]
movd      xmm1,DWORD PTR [rsp+rcx*8+0x70]
movd      xmm2,DWORD PTR [rsp+rcx*8+0x74]
...
; xmm0 contains 'c' vertex; create 64-bit pairs bc and ca in xmm1/3
movdqa    xmm3,xmm0
punpckldq xmm1,xmm0
punpckldq xmm3,xmm2
...
; write both pairs into two FIFO entries
movq      QWORD PTR [rsp+rax*8+0x70],xmm3
movq      QWORD PTR [rsp+rax*8+0x70],xmm1
...
; write the triangle abc to output
mov       QWORD PTR [rsi],rbp
movd      DWORD PTR [rsi+0x8],xmm0
Instead of simply using separate 32-bit registers, gcc instead uses vector operations for all of the FIFO update code - instead of two 32-bit writes for each FIFO entry, it synthesizes the 64-bit value from two 32-bit elements in SSE registers and writes the entire pair with a 64-bit store. It also reads the FIFO entry (ab) twice: once as two separate 32-bit elements, and once as a 64-bit GPR. The latter allows the compiler to directly store “ab” to the output buffer when writing the output triangle, although this changes when writing 16-bit indices.
This approach reduces the number of writes during the loop fairly significantly; it also allows for more instruction parallelism, as the rest of the loop (not shown here) uses many integer arithmetic instructions, so the SSE instructions can run in parallel on the otherwise idle units. All in all, this allows to reduce the cost of the decoding here by more than a cycle per triangle: a more than 10% speed improvement!
Note that the effectiveness of this technique depends on various efficiency properties of the target system; for example, c vertex is copied into xmm0 from a general purpose register and that copy has a cost. Reading the FIFO entry twice seems to work out in this case but it’s unclear what the impact would be on other CPUs. Also, replicating this in C++ code is certainly possible by using SSE intrinsics directly, but that makes the code less portable and somewhat more fragile wrt performance on MSVC.
I tried a similar approach using 64-bit integer registers and it generated worse code with clang and MSVC. So while the extra performance gains here seemed interesting, it was unclear how to best integrate this into the code without risking regressions - I shelved this until I could revisit it in the future and forgot about it…
Unpleasant surprise: gcc-15 x86_64
… until gcc-15 released last week. I ran a routine benchmark and was surprised to discover that gcc-15 was now producing code that, instead of being a little faster than clang’s, was significantly slower! While gcc-14 code ran at ~7.5 GB/s (~8.7 cycles/triangle), gcc-15 produced code that runs at ~4.8 GB/s (~13.6 cycles/triangle). A rather dramatic 5-cycle regression compared to the previous version.
I’ve expected some sort of significant difference in branching or loop structure, which are issues I’ve ran into on this code in the past, but I think I haven’t internalized just how key the FIFO load-store specifically is to this decoder loop. To spare you a few hours of bisection4 to find the offending gcc commit and compare the loop code alongside performance metrics, let’s just immediately look at the way gcc-15 compiles the FIFO access now:
; read FIFO entry as a 64-bit pair
movq    xmm0,QWORD PTR [r9+rcx*8]
...
; write bc edge to FIFO
pshufd  xmm1,xmm0,0xe5
mov     DWORD PTR [r9+rax*8],ecx
movd    DWORD PTR [r9+rax*8+0x4],xmm1
...
; write ca edge to FIFO
movd    DWORD PTR [r9+rax*8],xmm0
mov     DWORD PTR [r9+rax*8+0x4],ecx
...
; write triangle to output
movq    QWORD PTR [rsi],xmm0
mov     DWORD PTR [rsi+0x8],ecx
This doesn’t look too bad, does it? Gone is the redundant two-way read, so we only read the FIFO data once into xmm0; we then directly use that register to store the relevant bits into FIFO, and store it to the output buffer. There’s now four instructions that write to FIFO instead of two, but one that reads from it instead of three… all in all, not too bad? Ah, well… it’s time to talk about the title of this post.
Store-load conflicts
See, my earlier description of store-to-load forwarding was a little bit hand-wavy: the store ends up in the store buffer, and the load instruction checks the store buffer to see if it can read the data from that buffer instead. However, the store buffer in this case would contain two separate stores for each FIFO entry, that each have the 32-bit element they are writing. What happens if a single 64-bit load looks at the store buffer and sees two separate entries that, together, would provide the value for that load?
The answer depends on the microarchitecture, but your baseline expectation should be “nothing good”. Indeed, if we check the Zen 4 optimization guide, we will see (emphasis mine):
The LS unit supports store-to-load forwarding (STLF) when there is an older store that contains all of the load’s bytes, and the store’s data has been produced and is available in the store queue. The load does not require any particular alignment relative to the store or to the 64B load alignment boundary as long as it is fully contained within the store.
In our case, the load is actually no longer fully contained within the store. What happens, then, is that the store-to-load forwarding mechanism fails, and the load instruction needs to wait for stores to actually hit the cache. Mercifully, this is not as bad as what used to happen on PowerPC in case of an LHS: the penalty is much smaller and independent parts of the loop may still proceed, however at best this limits the throughput of the loop to the latency of an L1 load (7 cycles for SSE load) plus the latency of the L1 store. Chips and Cheese post measures the end-to-end penalty at 19 cycles; in our case, the entire loop ends up running at <14 cycles per iteration but there may be opportunities for partial overlap and not all triangles may need access to edges written by the previous triangle: if the edge we need is the edge written by the triangle before that, the latency may be mostly hidden.
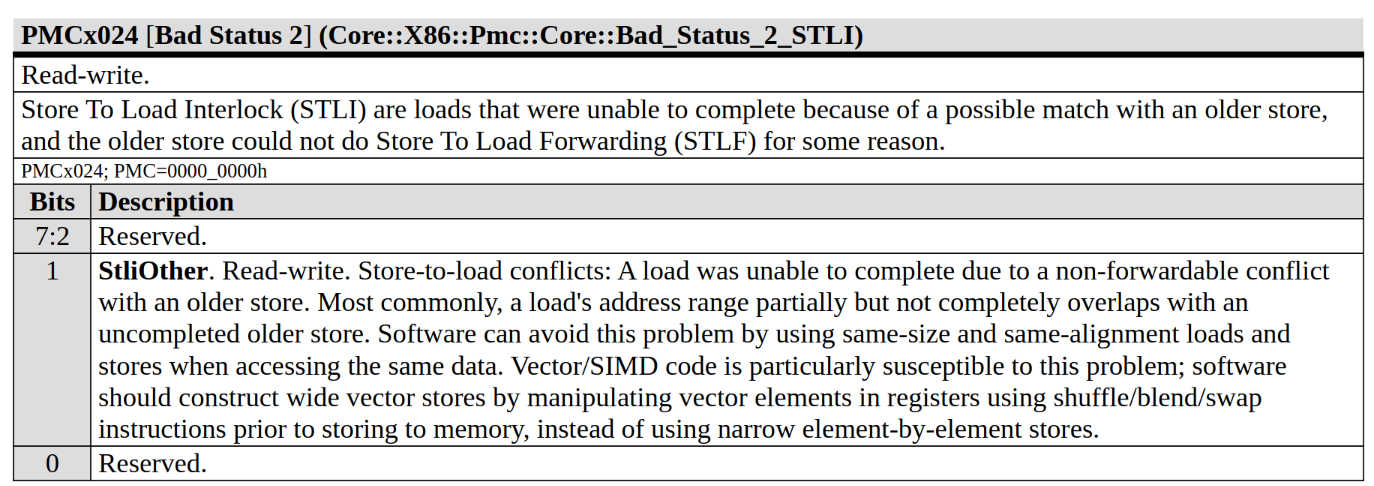
To confirm that this is what is happening, we can use AMD μProf, which allows us to gather performance counters and attribute them to individual functions. Specifically, the counter in question is the counter that tracks store-to-load forwarding failures, known as Bad_Status_2_STLI (store-to-load interlock). The description of the counter in performance counter reference is, however, pretty telling; indeed, SIMD code is particularly susceptible to this problem and it’s a bad idea to use narrow element-by-element stores if there’s a risk of the result being read as a wide vector!
The counter is enabled by default in the “Assess Performance (Extended)” set; profiling with that set, we get ~69 STLIs per thousand instructions. The number itself is a little surprising: with ~40 instructions in the loop body, just one of which is the offending load, we’d expect ~25 STLIs per thousand instructions - but we can compare with gcc-14 binary (~24 STLIs per thousand instructions) or clang-20 binary (~1 STLIs per thousand instructions) and confidently conclude that indeed, things are much worse now and STLI count has increased dramatically.
Curiously, while clang binary generates essentially no STLIs, gcc-14 binary generates an appreciable number. This might be due to the “double” access to the FIFO edge, where the loads of individual elements of the edge need to read data from part of the earlier, wider, store - AMD’s manual is silent on this but Chips and Cheese claims this introduces an extra 6-7 cycle latency. Perhaps STLI counts that in this case as well, but the latency ends up being hidden by the rest of the decoding and the actual loop performance doesn’t suffer in that case.
Unfortunately, in larger loops it’s more difficult to trace this problem back to the specific instructions that cause this. AMD supports “Instruction Based Sampling”, which tracks a number of counters associated with the execution of individual instructions, but it does not support gathering data about STLF issues in particular, and the cache latencies it collects do not allow pinpointing the problem, as the delay is not cache-related.
Using perf with -e ls_bad_status2.stli_other produces the following output which makes it a little easier to reason about the cause:
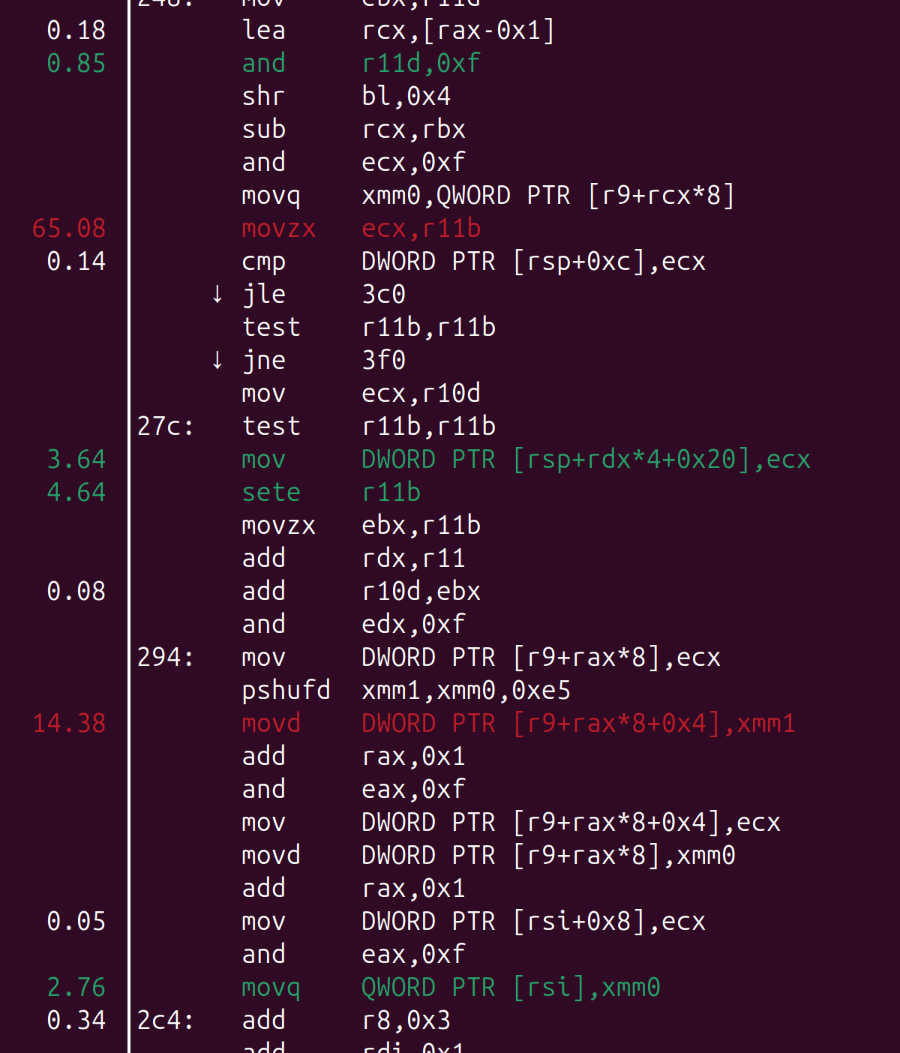
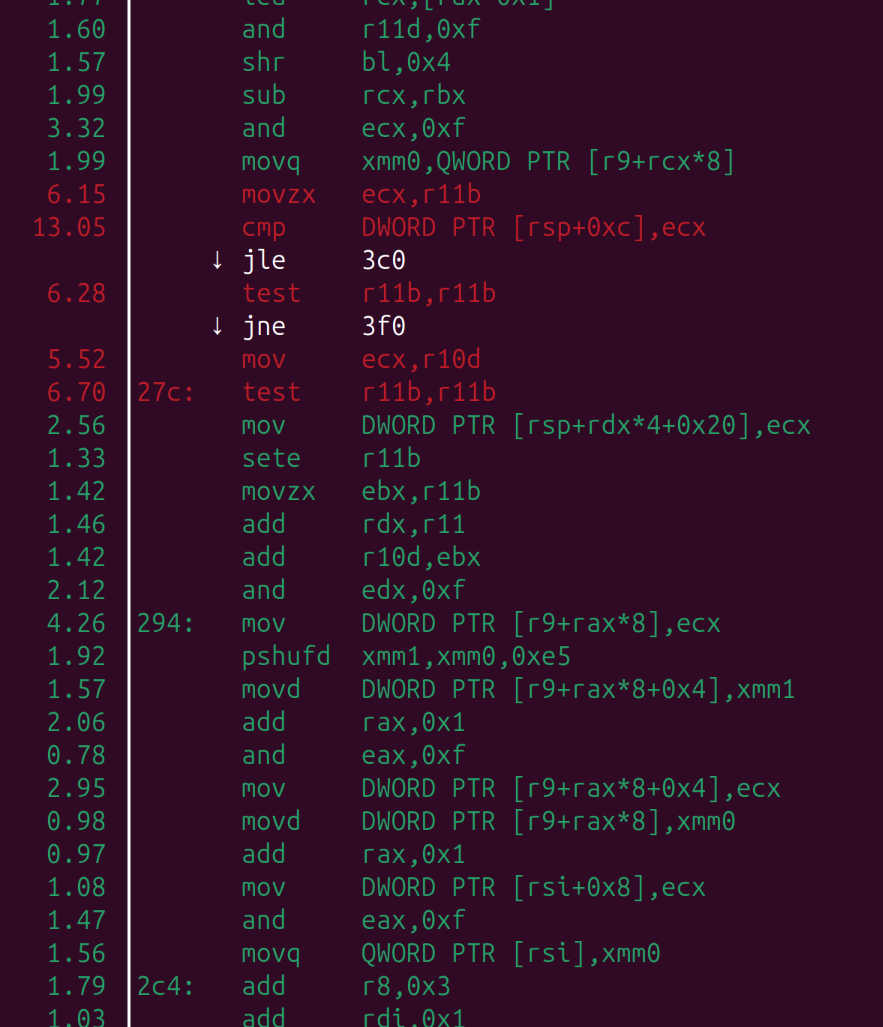
Here, the two instructions with lots of hits are the instruction that immediately follows the problematic load (it is typical for performance sampling to hit instructions that follow the expensive ones), and the instruction that is dependent on it. However, this only works because we already know STLI is the problem; the default profile is much less descriptive with a much longer and less precise skid window:
Surprising reversal: clang aarch64
While profiling the codecs earlier this year, I also briefly looked at the performance numbers on Apple CPUs. These numbers were impressively high: the same index decoder ran at ~7.3 GB/s on Apple M4 (4.4 GHz), equivalent to ~7.2 cycles/triangle. The number was impressive, and suggested that code generation was probably reasonable, so I did not look further. This was a mistake, because then two things happened in close proximity:
- gcc-15 was released, significantly degrading performance and causing me to look more into this general area;
- Xcode 16.3 was released, incorporating clang-17 - which increased performance on this decoder to ~9.8 GB/s (!!!). Clearly clang-16 was not that reasonable after all!
So let’s look closer at what happens on clang when targeting ARM and running on Apple M4.
When using clang-16 from the older Xcode 16.2, I was getting ~7.2 cycles/triangle per above. Similarly to x86_64, we will only look at the code that relates to FIFO access, as that’s the most important thing for this investigation. Let’s look at the assembly:
; read FIFO entry as a 64-bit pair into SIMD register
ldr   d0, [x15, x19, lsl 3]
...
; write bc edge to FIFO
str   w7, [x6]
orr   x6, x6, 0x4
st1.s ( v0 )[1], [x6]
...
; write ca edge to FIFO
str   s0, [x19]
str   w7, [x19, 0x4]
...
; write triangle to output
stur  d0, [x12, -0x8]
str   w7, [x12]
… okay then. We are seeing what is, essentially, the same code we have already seen gcc-15 generate for x86_64: when reading FIFO entry, we read it into a SIMD register using a 64-bit load; 32-bit components of that register are then written to two separate FIFO entries, along with the third vertex, as separate 32-bit stores. We have just seen this strategy result in a fairly catastrophic performance cliff on Zen 4 because the CPU can’t forward two separate stores from a store buffer into a single load. Is this, perhaps, not the case for Apple CPUs? Let’s refer to Apple Silicon CPU Optimization Guide:
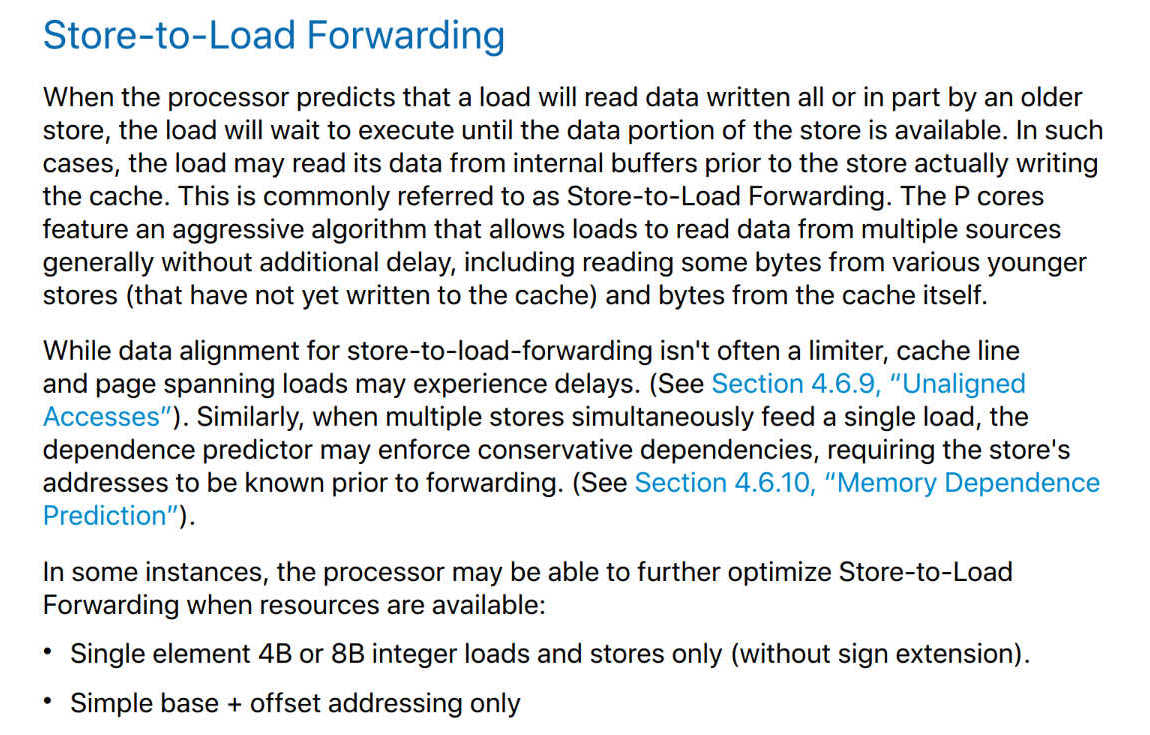
Interesting! It looks like on Apple chips, specifically on their performance cores, a 64-bit load may source both - or one of - 32-bit halves from the entries in the store buffer; this would explain why we are seeing solid performance (7.2 cycles/triangle) on M4 even though the code is seemingly inefficient. The manual, however, does say that this may introduce more strict dependencies, and does not allow more efficient single-element store forwarding, so let’s look at how the code and performance changes with newer compiler.
When using Xcode 16.3 (clang-175), our code runs at ~9.8 GB/s, or ~5.4 cycles/triangle, almost two full cycles faster than the clang-16 binary! And, lo and behold, if we look at the FIFO access we see this:
; load FIFO entry into two 32-bit registers
ldp   w20, w21, [x20]

; write bc edge to FIFO
stp   w20, w7, [x0]

; write ca edge to FIFO
stp   w7, w21, [x0]

; write triangle to output
stp   w21, w20, [x12, -0x4]
str   w7, [x12, 0x4]
This code is, broadly, equivalent to the x86_64 code we’ve seen clang generate - however, it relies on two incredibly useful instructions, ldp/stp, that AArch64 has and x86_64 doesn’t, that allow issuing two loads into two separate registers, or two stores. Presumably, these paired instructions are decoded into two separate micro-operations and execute separately, which completely removes “complex” store-to-load forwarding cases and, presumably, is what allows the code to run at peak efficiency here, at ~half the cycles per triangle compared to equivalent code running on Zen 4. Unfortunately, Instruments does not seem to expose performance counters that are relevant to store-load forwarding so it’s difficult to confirm that this is what happens, but the performance speaks for itself - Apple CPUs are impressive.
Curiously, if we use clang-16 to compile to x86_64 we will see the same, problematic, SIMD code pattern, matching gcc-15; additionally, neither clang-15 nor clang-17 exhibit this issue for either architecture. So this looks to be a regression that clang-16 introduced and clang-17 promptly fixed - making me feel better about not having spotted this issue before! Note that while Apple CPUs have unnaturally versatile load-store forwarding, I’d expect that most other ARM chips are not able to forward multiple stores into a single load - similarly, this would only be a problem for clang-16, and earlier and later versions should all work fine in this particular case.
I haven’t tracked the clang-16 issue down to a specific commit so I don’t know what exactly introduced this regression and what exactly fixed it; this can perhaps be left as an exercise to the reader.6
Conclusion
This hasn’t been the first time I’ve encountered store-to-load forwarding issues on x86_64 CPUs; however, I’m more used to these happening as a result of the code that explicitly tries to load or store mismatched element sizes. For example, this problem is prevalent, and requires a lot of care, when unions are used to operate on tagged values: something like this may often hit a case where the structure is filled using individual field writes, but is copied with a 128-bit wide load/store, which may present challenges in certain high-performance interpreters that would often expect the same value to be written and read in quick succession:
struct {
    int tt;
    union {
        bool b;
        void* p;
        double n;
    };
};
Regular structure copies may sometimes hit this problem as well, although these are often less latency sensitive. The index decompression code discussed here is an interesting scenario where all individual accesses in the source code are matched precisely, but the compiler may be eager to combine multiple loads and stores together - and unless it combines the stores, the combined loads may suffer.
In clang, this problem on this specific code is mercifully restricted to just a single, older (clang-16), compiler version; hopefully, gcc will follow suit and fix this in gcc-16. Unfortunately, the presence or absence of this problem is often ephemeral and depends on the exact code compiled, not just the compiler version; for cases where performance matters, beware store-load conflicts and pay close attention to the code compiler generates!
-
The compression ratio for triangle data is not state of the art compared to methods like Edgebreaker, but that’s an explicit design point, as we want a way to encode index buffers without distoring the vertex cache optimized order. The encoding is specialized to be friendly to general purpose LZ/entropy codecs, so the encoded output could be compressed further by LZ4/Zstd if needed. ↩
-
Or, to be specific, decimal gigabytes or gibibytes per second, which is the common unit of bandwidth measurement. If you have seen my Mastodon posts about this, or have read the numbers in my bug report, those use binary gigabytes and as such feature smaller numbers - sorry! ↩
-
The performance of writing to the output buffer is not critical here, but seeing these instructions may help understand the code flow a little better. ↩
-
I don’t often use bisection for issues like this, but in this case I was asked to file a bug report so I thought bisection would be useful to pinpoint the change that led to this regression. Note that this does not mean the change is necessarily incorrect; it simply has an unintended consequence of a devastating performance regression on this specific code. ↩
-
It’s not always clear how closely Apple clang versions track the official LLVM releases, but in this case the change in code generation can also be observed on non-Apple clang 16/17 builds ↩
-
This would be a good time to mention that you can clone meshoptimizer repository and run
make -B config=release codecbench && ./codecbenchto reproduce these results, usingCXXenvironment variable if necessary to adjust the compiler version. ↩
| « Measuring acceleration structures | Do not disrespect the fractal » |