A queue of page faults
21 Dec 2014Execution time in many programs is dominated by memory access time, not compute time. This is becoming increasingly true with higher instruction-level parallelism, wider SIMD, larger core counts and a lack of breakthroughs in memory access latency. A lot of performance talks now start by explaining that in a cache hierarchy the last-level cache miss is 100x or more expensive than a first-level cache hit, TLB misses are scary and contiguous data is great. But there is another beast that lurks in the depths of virtual memory subsystem, and its name is Page Fault.
Oh, hi. 1
Last week Bruce Dawson published a post Hidden Costs of Memory Allocation that explains an unconventional wisdom - large block allocation is expensive. While any seasoned C++ programmer has an adequate cost model 2 for small allocations, and there are all sorts of tools to deal with the cost - specialized free lists, bump-pointer allocators, data structures that favor arrays over separately allocated nodes - the allocations are usually perceived to have a cost associated with their number, not size.
Turns out, nothing is free - and allocating a multi-megabyte block has a real cost. What’s worse, this cost is not paid when the allocation is performed - it can be paid when you perform a memory access or even when a background thread in another process fills it with zeros. The post mentioned above describes the problem in more detail using synthetic tests - I want to focus on an easily measurable impact in a real application.
Measuring the cost
One of my projects, qgrep, is a fast grep database designed to quickly search through code bases of varying sizes using regular expressions. Performance is the main feature of this project (if you don’t care about performance you can just use grep) - most of the work involved was optimization and there were some interesting decisions made and algorithms used that I may blog about in the future. For now let’s focus on memory.
qgrep uses one “database” file that consists of a lot of compressed chunks stored sequentially. The main thread goes through the file, allocates enough memory for chunk processing (so that both compressed and uncompressed data fits), reads the (compressed) chunk data from the file and hands the chunk over to one of the worker threads. A worker thread decompresses the chunk data and performs regular expression search on the result. Worker threads don’t allocate memory - they work in the chunk memory that was allocated by main thread.
Chunks are usually around 512 Kb (uncompressed); the average compression ratio for source code is 1:4 so the main thread performs an allocation of roughly 512+128=640 Kb for every chunk, reads 128 Kb from the file and passes the result to one of the threads (there is a worker thread per core). Back in March 2012 I implemented a simple free-list pool for these allocations that resulted in significant speedups on some queries… But this free-list contains huge blocks - we’re using a block size of 512+256=768 Kb to satisfy ~640 Kb requests; how can it possibly be a win?
To find out, let’s profile the application and figure this out. I’m using Linux kernel v3.19-rc1 as the data set, and grepping for the regular expression fooo?bar that has the following matches3:
$ qgrep init linux ~/linux
$ qgrep update linux
$ qgrep search linux fooo?bar
~/linux/arch/m68k/include/asm/openprom.h:298:
    int vector; /* This is foobar, what does it do? */
~/linux/arch/sparc/include/asm/openprom.h:205:
    int vector; /* This is foobar, what does it do? */
~/linux/arch/um/include/shared/init.h:23:
 * extern int initialize_foobar_device(int, int, int) __init;
~/linux/drivers/block/pktcdvd.c:1462:
static int kcdrwd(void *foobar)
~/linux/drivers/block/pktcdvd.c:1464:
    struct pktcdvd_device *pd = foobar;
~/linux/drivers/of/unittest.c:407:
    selftest(rc == 0 && !strcmp(strings[0], "foobar"), "of_property_read_string_index() failure; rc=%i\n", rc);
~/linux/drivers/usb/storage/unusual_devs.h:667:
/* Submitted by Michal Mlotek <mlotek@foobar.pl> */
~/linux/include/linux/init.h:26:
 * extern int initialize_foobar_device(int, int, int) __init;
~/linux/tools/perf/util/quote.h:15:
 * sprintf(cmd, "foobar %s %s", sq_quote(arg0), sq_quote(arg1))
To find these matches, qgrep has to scan through 466 Mb of source data that is compressed to 122 Mb in 932 chunks. On my laptop it takes around 100 ms to find the matches using 8 threads. To analyze the effect the aforementioned change has on performance, we’ll run the tests on Mac OSX (32/64 bit process) and Windows 7 (32/64 bit process), using 1 or 8 threads and with or without allocation pooling and measure the wall time. Here are the results (averaged over 100 runs):
| Platform | 8 threads pool |
8 threads no pool |
1 thread pool |
1 thread no pool |
|---|---|---|---|---|
| MacOSX 32-bit | 131 ms | 142 ms | 570 ms | 610 ms |
| MacOSX 64-bit | 113 ms | 124 ms | 510 ms | 543 ms |
| Windows 32-bit | 120 ms | 204 ms | 433 ms | 471 ms |
| Windows 64-bit | 100 ms | 120 ms | 404 ms | 404 ms |
When the pool is not used, we end up requesting ~600 Mb from the system; when the pool is used, we can satisfy some requests using the free list so we end up requesting ~100 Mb with 8 threads and ~300 Mb with 1 thread. This makes sense since with 1 thread the data processing is slower so worker threads return allocated blocks to the pool more slowly and we end up with a larger queue of chunks.
The results in the table above mostly make sense - there must be some overhead associated with allocating memory and as Bruce Dawson’s post suggests this overhead grows with the total requested size. Switching to 64-bit improves performance since we have more registers so compiler can optimize inner loops better. However, there is an outlier - in 32-bit on Windows using the custom pool increases our performance almost two-fold. Wait, what?
Finding the reason
Let’s use the excellent Visual Studio Concurrency Visualizer tool4 to find out what’s going on! Here are the screenshots with 8-thread mode (click to enlarge):
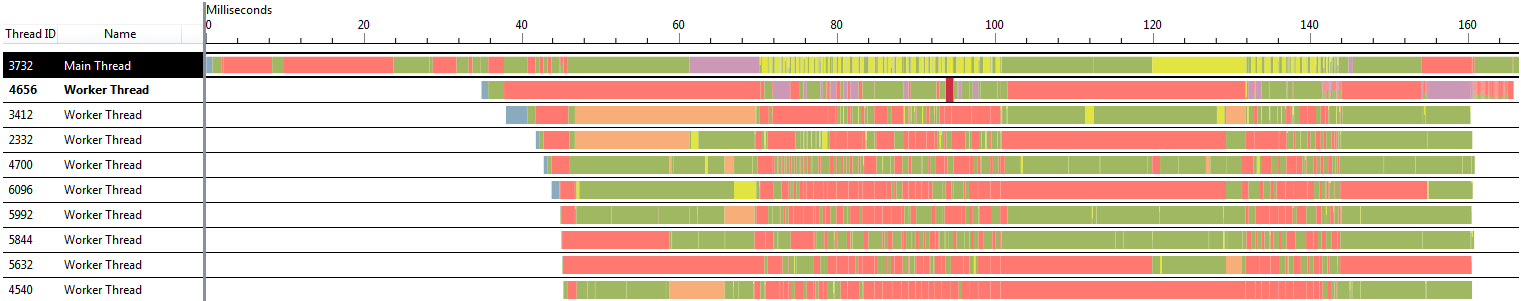
Using the pool
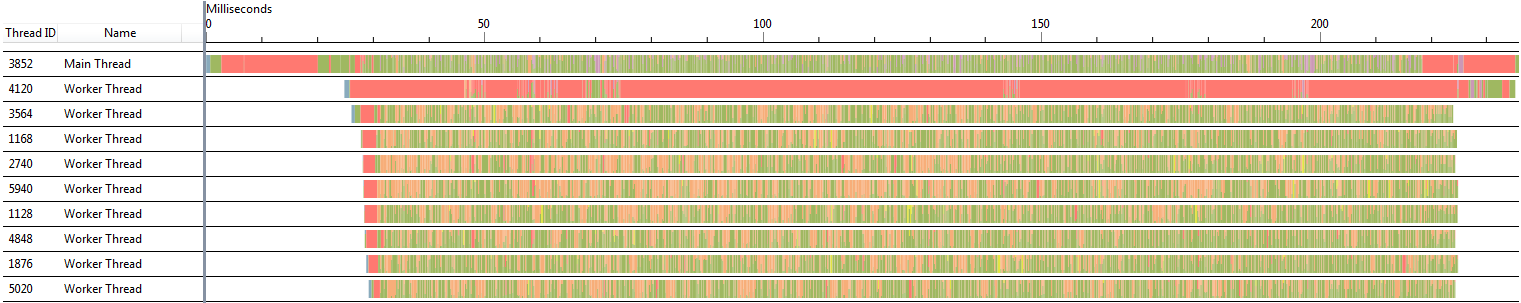
Not using the pool
The first “worker thread” in these timelines is the thread that handles output processing (it usually is not CPU-heavy but for some reason there’s a significant time in the first capture spent initializing console output…), and the remaining 8 threads handle decompression and search. Green sections represent CPU activity, red sections represent the thread waiting on a synchronization primitive and orange sections represent “memory management” - in our case, page fault handling.
As we can see, when we’re using the pool the threads are generally either doing work or waiting for more work to be queued by the main thread; however, when not using the pool we have a lot of orange sections everywhere up until the end of processing. Let’s zoom in and look at one of the orange sections:
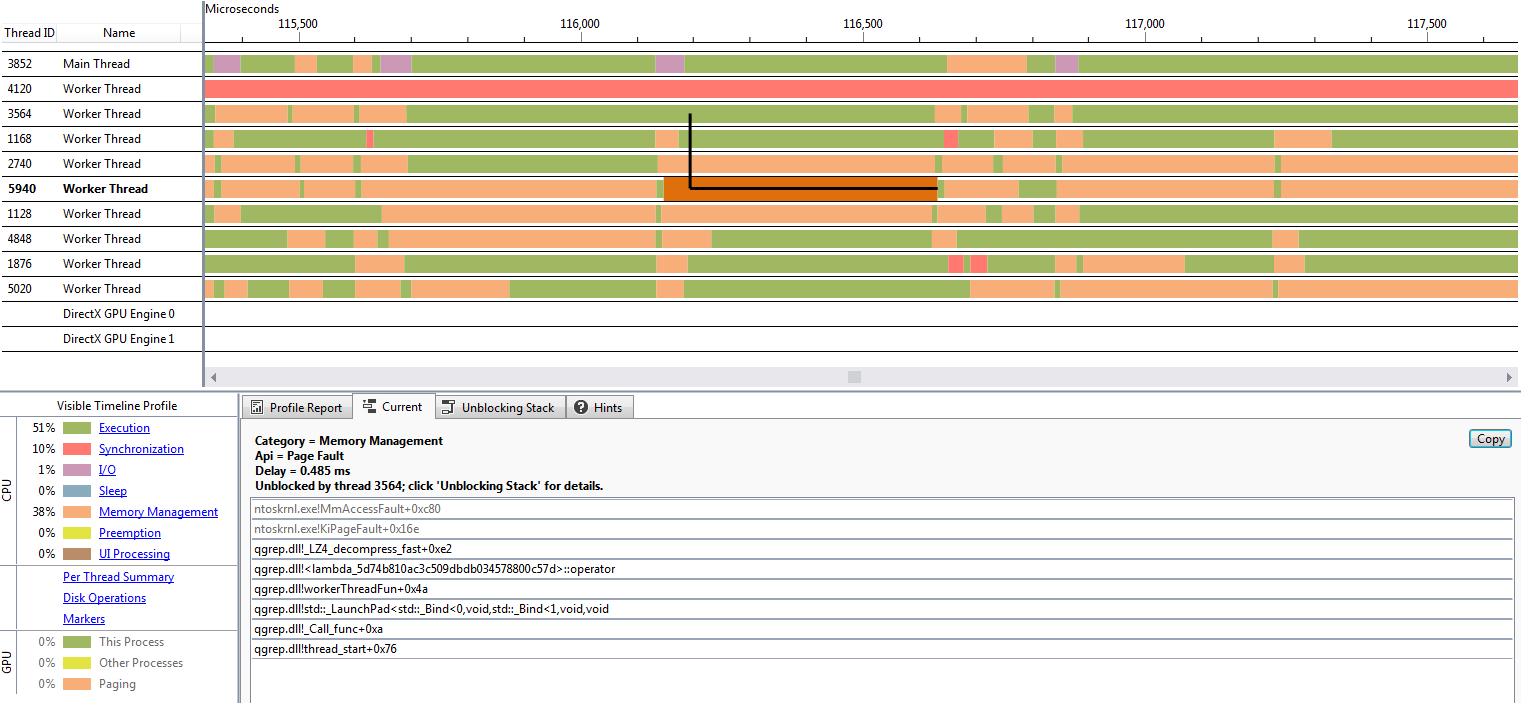
This is the curse of page faults. When we start using a memory page that has not yet been mapped to a physical location, we get a page fault that is handled by the kernel - so whatever code touches the memory first (like LZ4 decompression in this case) can suddenly get slower and if you’re not looking at the kernel stacks there is no way for you to find out. There is something else suspicious in this image though. In several instances we have multiple threads performing page fault handling, and the threads continue execution at almost exactly the same time! Is it possible that… page fault handling is serialized in the kernel?
Let’s look at some numbers. When the pool is not used, we’re allocating ~600 Mb from the system. We can confirm that we get page faults on all of this memory by inspecting the page fault counter (we can read it using GetProcessMemoryInfo call from Psapi.h); it’s 152k faults in our case which, given a 4k page size, means that every single allocation we perform is initially using non-committed pages so we have to pay the page fault cost.
Bruce Dawson measures the cost of page faults to be 175 μs per Mb, which for 500 Mb (600 Mb without pool vs 100 Mb with pool) is… wait for it… 87 ms. Which is suspiciously close to the observed timing difference (204 ms - 120 ms) for 8 threads. For 1 thread the memory difference is 200 Mb, and the timing difference is 38 ms which is exactly equal to 471 ms - 433 ms!
It looks like based on the observed behavior we can come to a conclusion - you will pay 175 μs for every megabyte of pagefaults (so ~680 ns for one page fault), page fault processing is single-threaded and if you happen to hit a page fault in two threads their execution will be serialized. Which can be a significant problem if you’re processing a lot of data using all available cores with otherwise heavily optimized code.
The devil is in the detail
But wait, why do we not see the problem on x64? Does the kernel map pages on x64 in a more performant way? Yeah, right.
Remember that you’re not really paying for memory that you allocate - you’re paying for memory that you use after mapping it into the address space of the process. Normally the heap implementation is designed to get memory from the system and keep it in various free lists without returning it to the system - however, not all block sizes are treated like this. Most heap implementations fall back to using virtual memory allocation above certain size.
You can refer to Windows 8 Heap Internals for an in-depth look at how Windows heap allocation/deallocation works; notice that for allocations larger than VirtualMemoryThreshold the implementation switches to VirtualAlloc5 that reserves the pages but does not fully commit them. VirtualMemoryThreshold is set to 508 Kb and our allocations are slightly larger than 512 Kb so we should use memory allocated with VirtualAlloc even on x64… right?
Alas, either the heap implementation is different on Windows 7 or the linked article is wrong - but the actual code that performs the decision on which allocation path to use in RtlpAllocateHeap looks like this:
# x86
shr ecx, 3
mov dword ptr [ebp-2Ch], ecx
...
mov eax, dword ptr [ebp-2Ch]
cmp eax, dword ptr [ebx+60h]
# x64
shr r13, 4
...
mov eax, dword ptr [rbx+9Ch]
cmp r13, rax
So the threshold - which is actually 65024 for x86 and 65280 for x64 - is defined in terms of allocation size granularity, which is 8 on x86 and 16 on x64. Thus on x64 the actual cutoff is 1 Mb, not 512 Kb, and our allocations fall below this threshold. This causes the heap implementation to use a free-list to satisfy these requests - which solves the memory mapping in a similar problem to our custom free-list since once we allocate and use the pages they will stay mapped into our address space so we’ll only pay the page fault cost once.
Now that we know that allocations have to use virtual memory subsystem directly for us to see a difference, we should wonder what is the actual behavior on Mac OSX. The observed performance difference is not significant - but maybe this is because it’s not using newly mapped memory for every chunk. We can switch to mmap/munmap to find out:
| Platform | 8 threads pool |
8 threads no pool |
1 thread pool |
1 thread no pool |
|---|---|---|---|---|
| MacOSX 64-bit Using malloc |
113 ms | 124 ms | 510 ms | 543 ms |
| MacOSX 64-bit Using mmap |
107 ms | 165 ms | 510 ms | 604 ms |
Upon a cursory glance at magazine_malloc.c it looks like large allocations are cached (see LARGE_CACHE) under certain circumstances, which can explain why using mmap results in a noticeable performance difference when disabling allocation pooling.
Interestingly, the timing differences for mmap may suggest that the OSX kernel actually does not serialize page fault requests from multiple cores - disabling the pool with 8 threads results in extra 58 ms for extra 500 Mb of allocated memory (8.4 Gb/s), whereas disabling the pool with 1 thread results in 94 ms cost for 200 Mb of memory (2 Gb/s), so the processing seems to scale with the number of cores. It should be possible to confirm or disprove this by reading the kernel sources but this post already took too long to write - please leave a comment if you know whether this is accurate!
Conclusion
This article takes another look on an effect of (soft) page faults on performance. Note that the resulting performance difference is very dramatic - admittedly, this is a somewhat special case because the rest of the processing is highly optimized (page faults at 5.7 Gb/s start to be noticeable once your processing itself performs at 6 Gb/s…).
Having said that, this is actually quite common - a lot of components that are widely used turn out to be really slow once you set very aggressive performance limits. Slow single-core page remapping makes certain interesting approaches like C4 garbage collector infeasible, among other things6.
Investigating performance issues requires good tools and willingness to dive deeply into implementation details. I wish more platforms had good built-in profilers with timeline visualization similar to Concurrency Visualizer. I wish some platforms shipped with an open-source kernel. Will we see Windows kernel on GitHub one day?
Thanks to Bruce Dawson for corrections and suggestions for clarification.
-
Time flies. If you remember this blog from 4 years ago you may have noticed that I changed the blogging platform again. This resulted in some spurious RSS updates - sorry about that! Posts and comments have been migrated and the feed should be stable now. Please let me know if something is off. Oh, and I will not promise to blog on a regular basis since apparently it does not end well. ↩
-
I may be exaggerating here since the actual overhead of small allocations depends a lot on the implementation details (operating system version, process bitness, etc). The cost model usually boils down to “they can be expensive”, which is probably good enough. ↩
-
Why not
foobar? Wait until another article aboutqgrepinternals to find out! ↩ -
This is a profiler that uses ETW to gather important events about the system and displays them with a UI that you can actually enjoy using, unlike other ETW-based tools Microsoft provides. The tool is not yet available for Visual Studio 2015 so we’ll use Visual Studio 2013. ↩
-
… which causes the implementation to call
VirtualFreeon deallocation instead of putting the block on a free list. ↩ -
A few years ago I had to stop using memory mapped files in .NET because the thread that waits for hard page fault (which takes ages compared to a soft page fault!) often blocked the thread performing virtual memory operations as a part of GC processing, resulting in I/O stalls affecting the entire application. ↩
| « Quantizing floats | Approximating slerp » |